MLB Lineup Drops: The Two Minutes That Move the Market
MLB lineup drops move sportsbook prop prices within minutes. A season of data shows how often, by how much, and how reading the league feed beats the tweet.


When an MLB lineup drops, the player prop markets for that team can move within seconds. A hitter who was projected to bat seventh is suddenly leading off, and his odds to get a hit, reach a base, or drive in a run all shift at once, because batting higher means more trips to the plate. We tracked a full season of these lineup drops to answer three questions: how often a drop actually moves the market, how long the market takes to catch up, and whether you can reach the news before the tweet the whole market is waiting on.
Get the data
We are releasing the full dataset behind this study: the odds movements around every Underdog MLB lineup post of the 2026 season, roughly 85 million rows across 73 books and six markets, so you can reproduce any number here or run your own tests. Get it on Hugging Face.
Try it: watch a lineup drop
Pick a player below. You will see where the projected lineup had him hitting, where the team actually put him, how many spots that moved him, and what it did to his price. These are four real lineup changes from a single afternoon.
Watch a lineup drop hit the market
Four real lineup changes from July 20, 2026. Pick a player to see what the projected lineup said, what the team actually posted, and what that did to his price.
- 1D. Baldwin
- 2Ozzie Albies
- 3Matt Olson
- 4M. Harris
- 5M. Dubon
- 6D. Smith
- 7Austin Riley
- 8Jim Jarvis
- 9B. Hicklen
- 1Drake Baldwin
- 2Ozzie Albies
- 3Matt Olson
- 4Austin Riley
- 5Michael Harris II
- 6Mauricio Dubón
- 7Joey Bart
- 8Jim Jarvis
- 9Eli White
This is not one book reacting. 20 of the 26 sportsbooks quoting this line shortened it within ten minutes of the drop.
Real prices from our odds archive. The chart plots the price each book was offering, so the reference line dropping below the slow one is the gap you could have taken; the fair price and the edge have the book's margin removed. One afternoon is an illustration, not a forecast, and any single bet can still lose.
The chain is the whole story: a player moves in the order, that changes how many times he comes to the plate, that changes how likely his props are, a quick book reprices, and a slower book sits on the old number for a while longer. The rest of this piece is how we measured that across a season, and what it means.
How often do lineup tweets move the market, and by how much?
Lineup news reaches the betting world through one place: the Underdog MLB account on X. It is the account the industry watches, the shared clock everyone starts from. When a lineup lands there, it is public.
But not every lineup is news. Most days a team posts close to what the market expected, and the prices barely move. So the first question worth answering is how often a lineup actually moves the market, and by how much.
First, which markets can move at all. The ones that care about a batting order are the counting stats, where clearing the line depends on how many times a hitter comes to the plate: total bases, hits, RBIs, runs, and the combinations that add them together. Move a hitter from seventh to second and he picks up about half an extra trip to the plate, and every one of those lines has to shift with him. Pitcher strikeouts move for the mirror reason, because the lineup the pitcher faces just changed. Those six are the markets we tracked.
From late March through mid July we matched 2,917 Underdog MLB lineup posts against our archive of live sportsbook odds and asked, for each one, whether the de-vigged consensus, the market's fair price with the juice stripped out, actually moved. About half of the posts moved at least one market by two points or more beyond the vig. A point here is one percentage point of a bet's fair, de-vigged chance of hitting, so a line that moves from a 45 to a 48 percent chance has moved three points. And a post that moved something rarely moved just one line: the typical market-moving post shifted three markets at once, and the busiest shifted nine or more. Across the season that came to 6,659 distinct market moves.
The moves clear the juice without being lottery tickets. The typical one shifted the fair price a little under three points beyond the vig, and the sharpest reached five or more. That is the size of edge a slow book can leave sitting on the board for as long as its price stays stale.
How often, and how far, a lineup moves the price
Of 2,917 Underdog MLB lineup posts, about half move nothing. The rest are grouped by their biggest move, how far the fair price shifted beyond the vig.
Each post’s biggest de-vigged move, in probability points. That is how far the true price shifted; a slow book still on the old number leaves roughly that much on the board, before its own margin.
The other half of the posts is the other half of the story. When a lineup lands about where it was expected, the market shrugs and there is nothing to do. The whole game is knowing, in the moment, which half of the board you are looking at. That is what the rest of this piece is about.
Who catches it first?
Once a lineup moves the market, the books do not move together. Some reach the new price within a minute, some sit on the old one for several. That spread is the opportunity: while the quick books have already moved to the new fair, the slow ones are still showing a number the news has passed by.
We measured how long each book took to reach the new fair price and hold it, then compared every book to the middle of the field on the same move. Read the result as a rough map rather than a stopwatch: the order at the very top is a close pack, and a book we happen to poll more often can look a step quicker than it really is. The gap that matters, quick versus slow, is far too large to be noise.
| Fast | ahead |
|---|---|
| DraftKings | ~40s |
| Stake | ~40s |
| Pinnacle | ~30s |
| Novig | ~15s |
| Caesars | ~5s |
| Slow | behind |
|---|---|
| Bovada / Bodog | ~55s |
| Betano | ~60s |
| bet365 | ~70s |
| Fanatics | ~120s |
| PointsBet | ~230s |
The surprise is which names fall where. DraftKings, a mainstream US book, is among the quickest to a usable price, while the slow group is full of names just as big, bet365, Fanatics, PointsBet. Size and reputation do not predict speed. At the far end, Bookmaker barely reprices at all, reaching the new number on only about one move in five and leaving the old price up the rest of the time. And even the quickest books take a few minutes to settle, and the field takes past five minutes, time in which a stale line simply sits there.
Fast is not the same as sharp
This squares with our own research on sharp money. Our sharpest sportsbooks study found the sharpest fair value belongs to the exchanges, Kalshi and ProphetX, with Novig just behind, and that Pinnacle, quick as it is here, may not actually be sharp on these markets.
Beating the tweet
So far everything is measured from the moment Underdog posts, because that is when the news becomes public. But does it have to be? The post is quick, but it still takes time. So we tried to get there first.
The lineup is not born on X. It is published on the league's own feed, and Underdog reads that feed and posts what it finds. Reading and posting takes time. If we watched the feed ourselves, we would know what Underdog was about to say before it said it.
So we built the watcher and ran it live, timestamping the moment each lineup appeared on the feed and lining those timestamps up against the posts.
It usually wins. Across 158 lineup publications where we captured both, we had the lineup first 92 percent of the time, with a median lead of 38 seconds. The losses were narrow, a handful of seconds here and there. The biggest wins were not close at all: on 18 July we had the Mariners lineup nearly five minutes before Underdog tweeted it, and the Giants the next afternoon by a little over four.
We read the lineup before the tweet lands
Across 158 lineup drops from 17 to 23 July, our feed watcher had the lineup before Underdog posted it, a median of 38 seconds sooner.
Forty seconds is not much, but it is the difference between reacting to the race and starting it. Every book in those tables spends its first minutes catching up to a number the feed already knew. Reading the feed yourself means you are watching that move develop rather than learning about it after the tweet, while the slower books are still showing the old price. None of this removes the frictions any experienced bettor knows: books move fast, limits are real, and a price you see is not always a price you get. But a repeatable pattern in the data is the kind of thing software is good at watching for you.
Lineup Dropper: this study, running live
Everything so far is a look back, a season of lineup drops measured after the fact. But none of it is really history. The same thing happens live every afternoon: a lineup lands on the league feed, the market has not caught up yet, and for a few minutes the slow books are showing a number the news has already changed. The hard part is not the idea. It is doing it in real time, on every game, without sitting on a feed and refreshing it yourself.
That is a job for software, and it is the one we built. Lineup Dropper is SmartStake's real-time MLB lineup tool. It reads the league feed the moment a lineup lands, works out which players changed and in which direction that pushes each of their markets, and charts every book's price through the drop, so the ones still sitting on the old number are the flat lines, before the tweet the rest of the market is waiting on has even fired. It does the two things this piece is about, getting to the news first and reading what it moved.
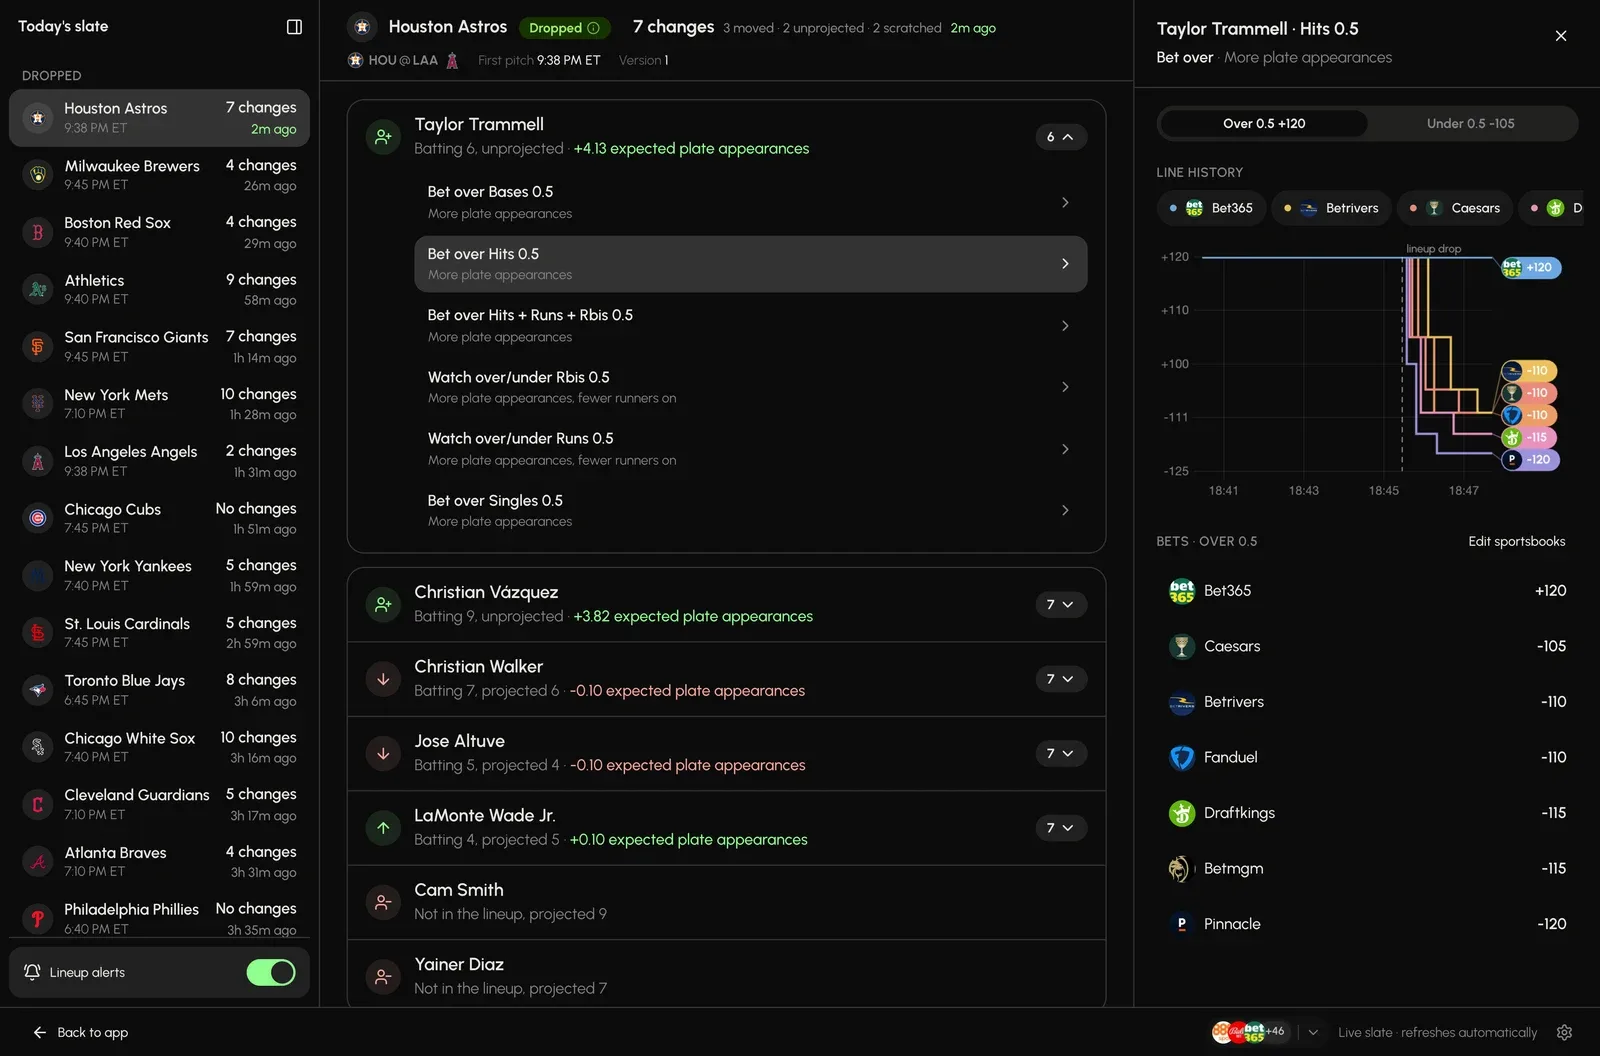
Here it is on a live slate. The left rail is the day's wire: lineups that have dropped, newest first, with how many changes each one carried, and the games still on deck. The Royals lineup has just landed with six changes, and the tool has already read every one of them.
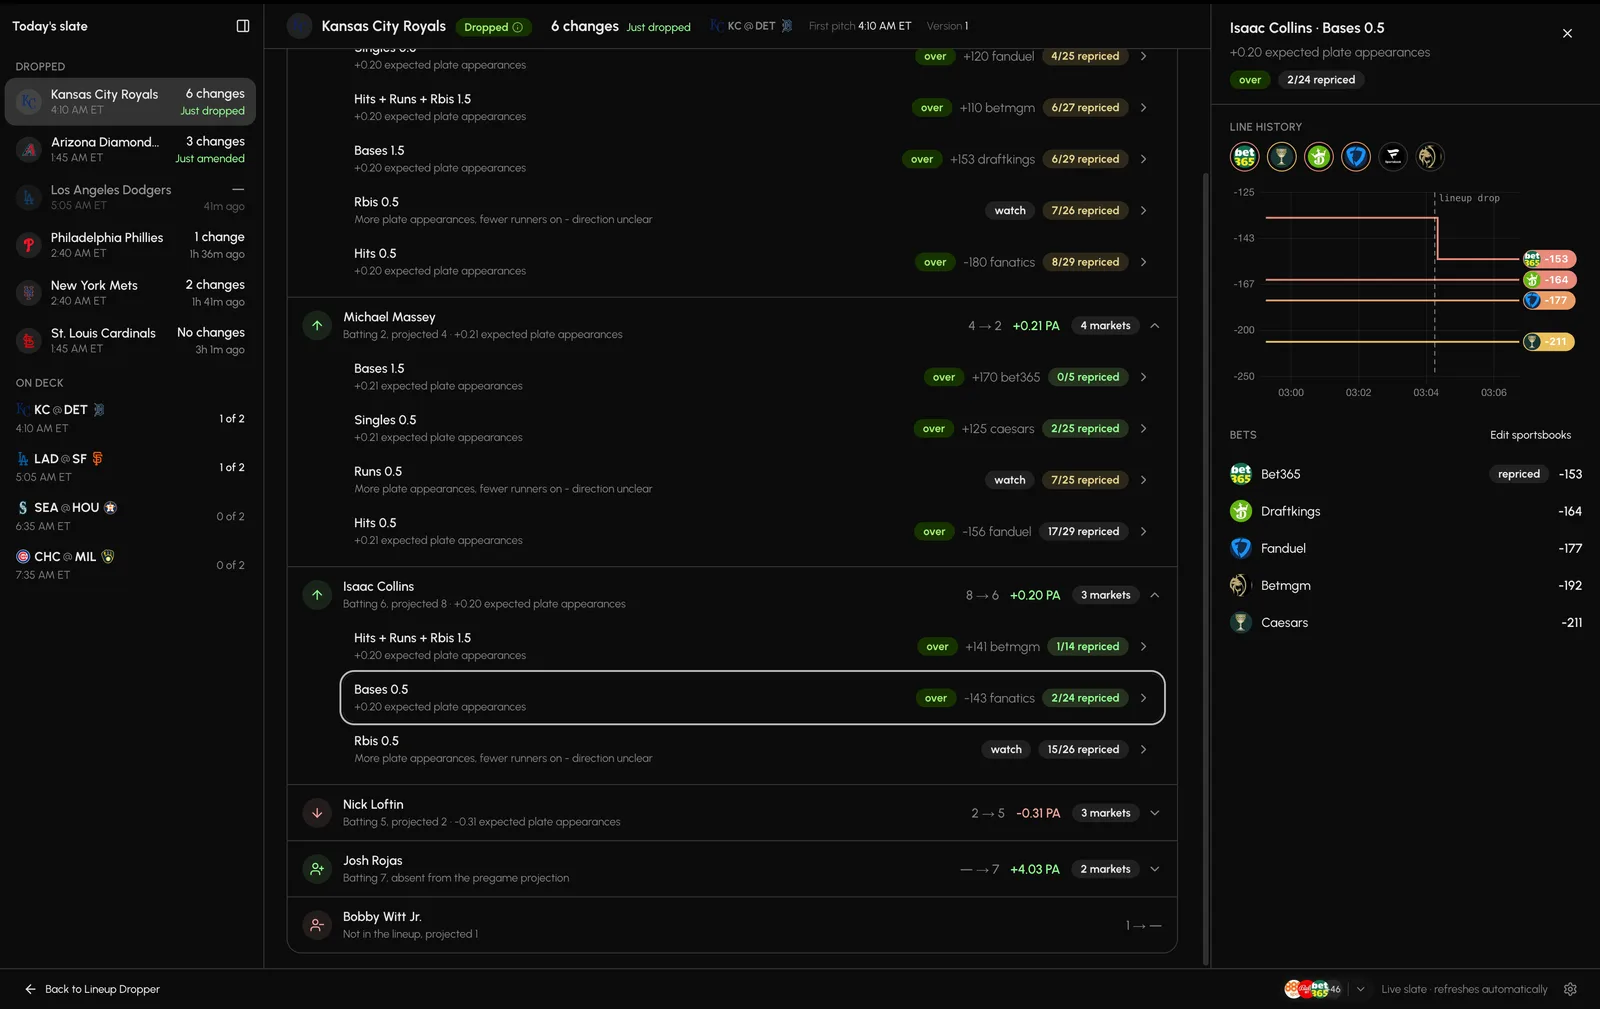
The center pane is the reading. Isaac Collins was projected to bat eighth and the Royals put him sixth, worth about a fifth of an extra plate appearance, so his counting-stat overs all got more likely. Each market he touches is listed with the side the change argues and the reason in one line.
Drill into one bet and you get the panel on the right, and the live answer to this article's question: the line history at every book, with the drop marked.
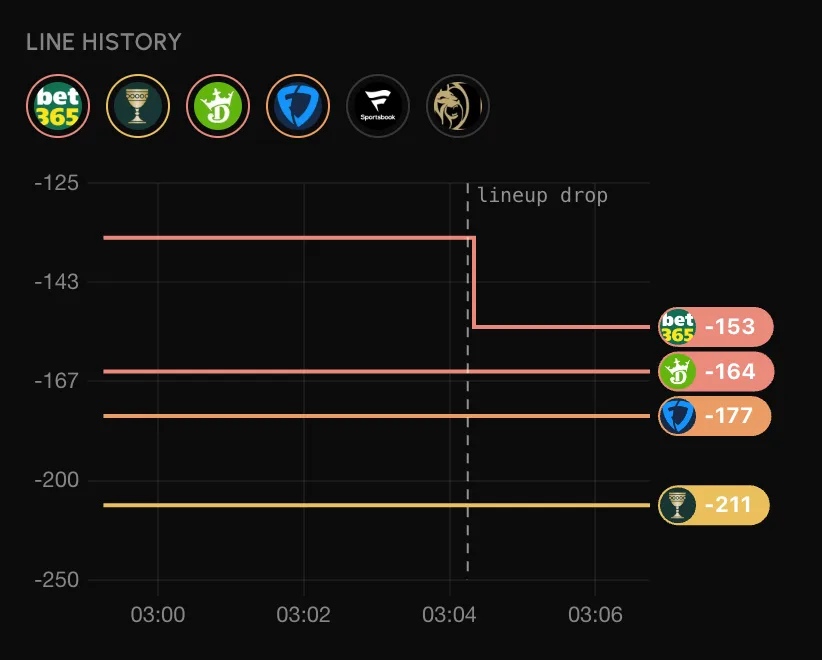
This is the whole study in one picture, running live. The dashed line is the lineup landing on the feed. bet365 steps to its new number within seconds, and every other book is still flat on the price it had before the news. The season of data told us that gap exists and roughly how long it lasts; the chart shows you the one that is open right now.
Late changes get the same treatment. When a lineup is amended after it first posts, a scratch or a reshuffle, the lineup floats back to the top of the wire and the clocks restart from the amendment, because that is the moment the market got new information, not the original post.
Get first access, free
We are giving away first access to Lineup Dropper at no cost. Head to Lineup Dropper to get in, or read the walkthrough first to see what it puts in front of you.
A note on methodology. Every figure here comes from SmartStake's own archive of live sportsbook odds. The study covers 2,917 Underdog MLB lineup posts from 25 March to mid July 2026, across the six batter and pitcher markets named above. A market counts as having moved when the de-vigged consensus, taken from the books that make a two-sided market, shifted at least two points beyond the vig; by that bar about half the posts moved at least one market, 6,659 in all, and the magnitudes quoted describe those qualifying moves. Time to convergence is the seconds a book took to reach the new fair price and hold it, reported as medians centred on each event, so a book is only compared to the field on the markets it quotes; the speed figures are approximate and sensitive to how often each book updates, so treat the ordering as directional rather than exact. Books sharing one pricing engine are counted as a single entry (BetMGM with bwin and Sports Interaction; Pinnacle with its sister site). FanDuel prices only one side of these batter markets, which leaves no fair to grade it against, so it is left out of the speed figures. The 38 second figure is the median lead across 158 lineup publications between 17 and 23 July 2026 where we captured both the league feed and the post; we were ahead in 92 percent of them, with individual leads from a few seconds to several minutes. These figures describe historical patterns in that sample and vary by day, market, and book.
- Odds, prices, expected value, conversion rates, and profit figures shown are estimates based on the last data we retrieved. They can change at any time — confirm the current price at the book before you bet, as odds may move and entry errors can occur.
- Using a “sharp” book as a fair-value reference is a modeling choice, not a statement of accuracy. Review a book’s record yourself and anchor on the books you trust.
Get the next guide in your inbox
Practical betting guides, new tools, and product updates from the SmartStake team. Unsubscribe in one click, any time.
By providing your email, you are consenting to receive communications from SmartStake. Visit our Privacy Policy for more info